
Real-time intelligence you can explain
NSI detects anomalies as they happen and shows WHAT, WHY, and HOW — delivering transparent, actionable insights you can trust in production.
Why black-box AI fails in the real world
Enterprise data streams move too fast and change too often for static machine learning to keep up. Current AI approaches are built on fragile foundations — huge datasets, endless retraining, and opaque results that can’t withstand real-world pressure.
❌ Data hunger — requires millions of labeled samples just to start.
❌ Constant retraining — models degrade under drift, demanding continuous updates.
❌ Opaque outputs — delivers scores without causal explanations.
⚠️ Fragile in production — when streams shift, models collapse.
🔒 No regulatory answers — black boxes cannot justify their decisions.
Explainable real-time intelligence that adapts to your data
NSI (Nonlinear Semantic Intelligence) answers the core questions every operator asks:
WHAT — what happened in your system
WHY — why it happened, with causal drivers
HOW — how to act, via guided hints (and future auto-regulation)
To deliver these answers, NSI reconstructs dynamic semantic graphs directly from raw data streams.
🔗 Edge plasticity: each edge adapts with age, support, and reinforcement — capturing how signals co-activate in real time.
🧠 Motif mining: recurring subgraph patterns become a structural memory of causal fragments.
🤖 Dynamic calibration: guardrails continuously adapt to stream statistics, removing manual tuning and retraining.
The outcome: real-time anomaly alerts that carry their own explanations.
Instead of: “anomaly score = 0.87”
You get: “motif M17 failed in cluster C3, edge density dropped by 34% — likely causal anomaly.”

What you get
Here is a real snapshot from district heating pipeline data. The system continuously monitors pipeline behavior and highlights structural shifts in real time. In this case, NSI detected a medium-severity change between two connected pipelines — with a built-in explanation and action hint.
How to read this snapshot
What happened
The system detected a scene shift — a structural change in behavior at time t=103.Where
Pipeline_1 (orange) is the driver, influencing Pipeline_2 (blue). Other elements appear in gray for context.What changed
ΔP = –0.0016 signals a negative shift; current probability P = 0.46. Severity is medium.Which metrics
Volume, thermal energy, and temperature contributed to this change.What to do
Check these metrics and adjust thresholds or operating regimes as suggested in the action hint.
Today the system provides guided recommendations — tomorrow, agent-based auto-regulation can apply these adjustments automatically.

What makes NSI different

No labels
structure is learned from stream dynamics (edge plasticity, motif mining), not from annotated datasets.
Explainability by design
every alert links back to motifs, edges, and causal relations.
Resilient to drift
adaptive thresholds recalibrate online; models do not “expire.”
Real-time operation
stream processing with millisecond latency.
Multimodal core
numeric signals, events, and time-series can all be embedded into semantic graphs.
Where NSI works best
Where black-box AI is too fragile, NSI thrives:
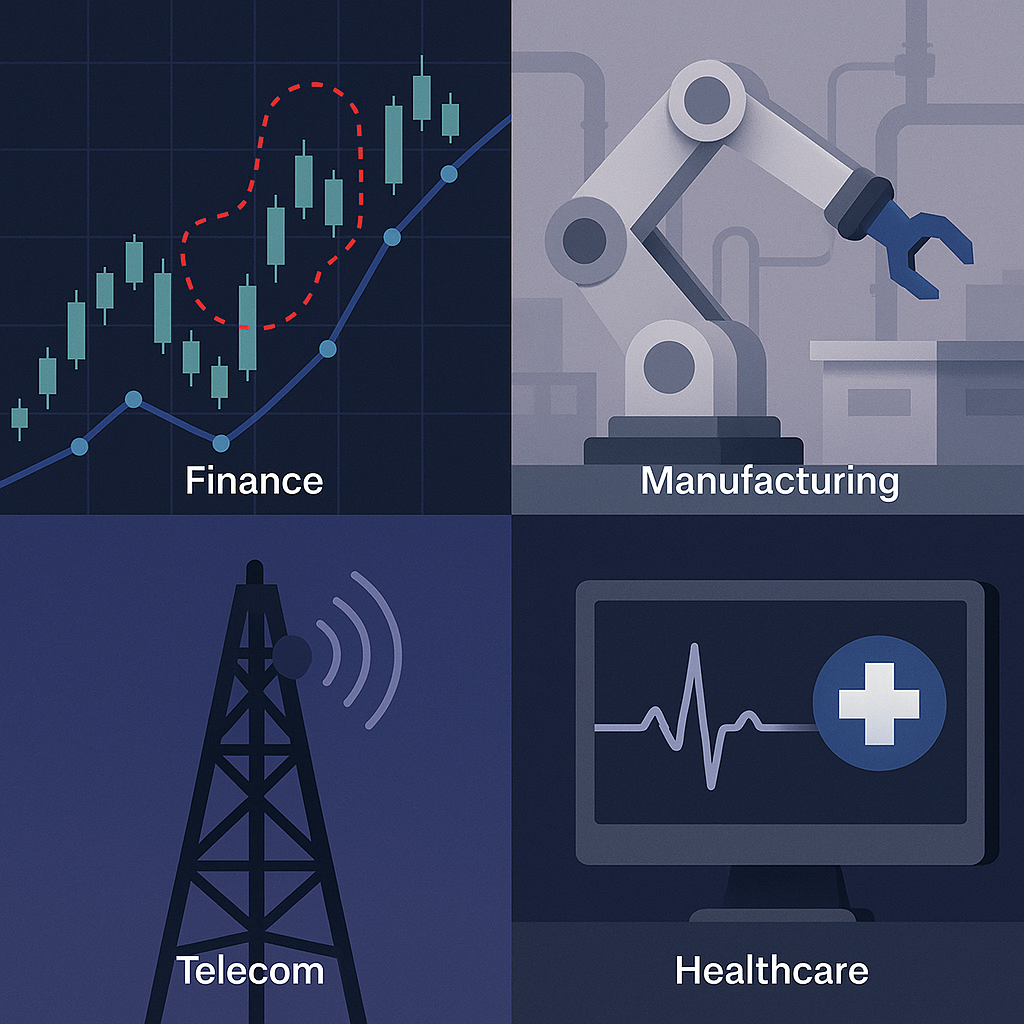
Finance & Retail
Fraud detection, market shifts, and pricing alerts explained through causal graphs.
Industry & Manufacturing
Predictive maintenance and early fault detection from sensor streams.
Energy & Telecom
Grid and network anomaly detection explained as structural shifts.
Logistics & Supply Chains
Bottleneck detection and inventory balance alerts in real time.
Healthcare
Patient monitoring with transparent alerts on regime changes in vital signs.
…and beyond → logistics, energy, critical infrastructure, security
How the pipeline works
NSI ingests raw numeric and temporal streams, preparing them for analysis
↓
Graph dynamics
data points are organized into evolving semantic graphs, where relations adapt over time
↓
Motif mining
recurring substructures are detected and stored as a memory of system behavior
↓
Guard calibration
reference levels adjust automatically to the stream, keeping alerts stable
↓
Semantic alert
anomalies are delivered with built-in causal explanations, via API or streaming connectors
Instead of a black-box score, NSI delivers a living semantic map of your system, where every anomaly is an explained structural deviation.
Bring explainable intelligence with NSI
We are opening pilot projects in finance, telecom, industry, healthcare — and beyond. NSI delivers real-time semantic alerts, explainable pattern libraries, and adaptive system maps.

© 2026 • Build systems that reconstruct the structure of reality